Transit agencies: Have you looked at your website’s statistics lately?
There’s a lot to be learned from looking closely at your website’s visitor statistics. I recommend to my clients that they use Google Analytics to track visitors on their websites because it’s free, easy-to-implement and use, and provides a lot of information (much, much more than I’ll breeze through here).
Recently, I was digging around in the statistics for Redwood Transit System and thought I would share some of the things that stood out (with the manager’s permission, of course).
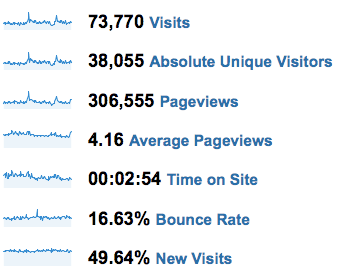
First, here are redwoodtransit.org visitor statistics for roughly the past year.

73,770 visits is significant traffic for an agency that posts about one-half million boardings per year. If people successfully find the information they are after, each one of those visits would probably result in at least two boardings — one to get there, and another for a return trip.
Note the “bounce rate” — that’s the number of visitors who immediately leave the site because they haven’t found what they are looking for or are at the wrong site. 16% is a low bounce rate. And note that once people are on the site, they stick around, looking at an average of 4.2 pages. Imagine the cost of printing all those 306,555 pages viewed, or answering those questions by phone.
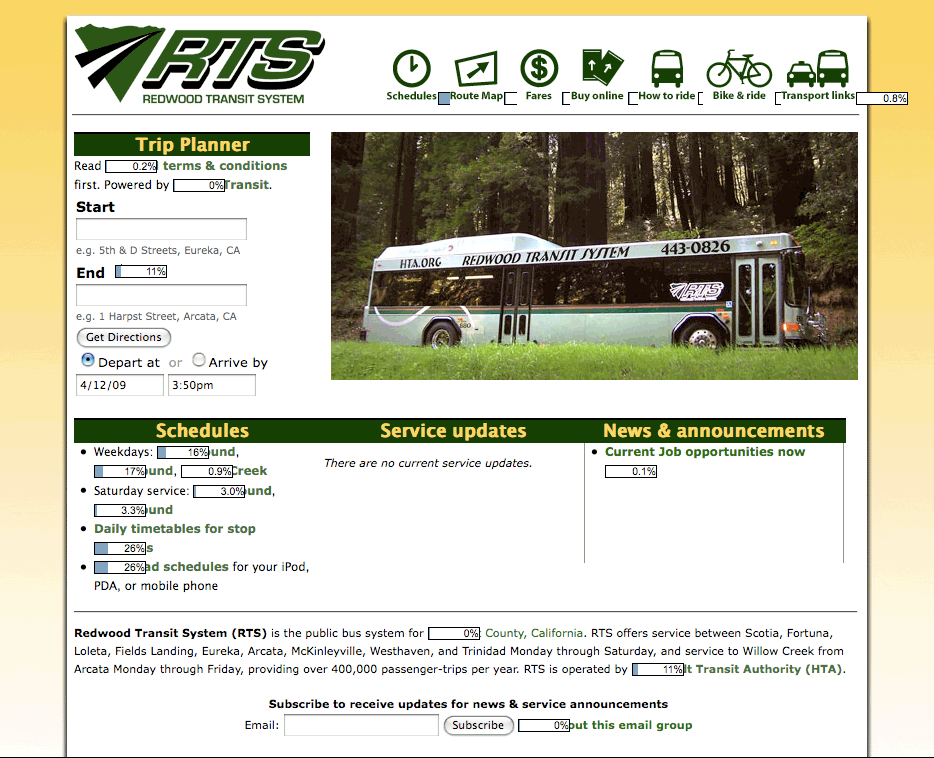
Second, here is an “overlay” that shows the links visitors clicked on.

As I would expect, schedules are, by far, the most popular piece of content on the site. But one thing that stood out at me is number of people that click the button to flip start and end addresses. It looks like this (![]() ). You can’t see it above because it’s obscured by the overlaid visitorship statistic (11%) after (“End”) in the trip planner box.
). You can’t see it above because it’s obscured by the overlaid visitorship statistic (11%) after (“End”) in the trip planner box.
Anyway, statistics for the number of trips planned using the Google Transit trip planner are not available because trip planning happens off the RTS website, at maps.google.com. But that 11% figure gives a clue. If 11% of people who visit this page click that little button (which I’ve rarely used), then many, many more are clicking the “Get Directions” box without ever clicking the flip start/end address button.
And, don’t forget the people who plan transit trips by going to maps.google.com without ever visiting the RTS website.
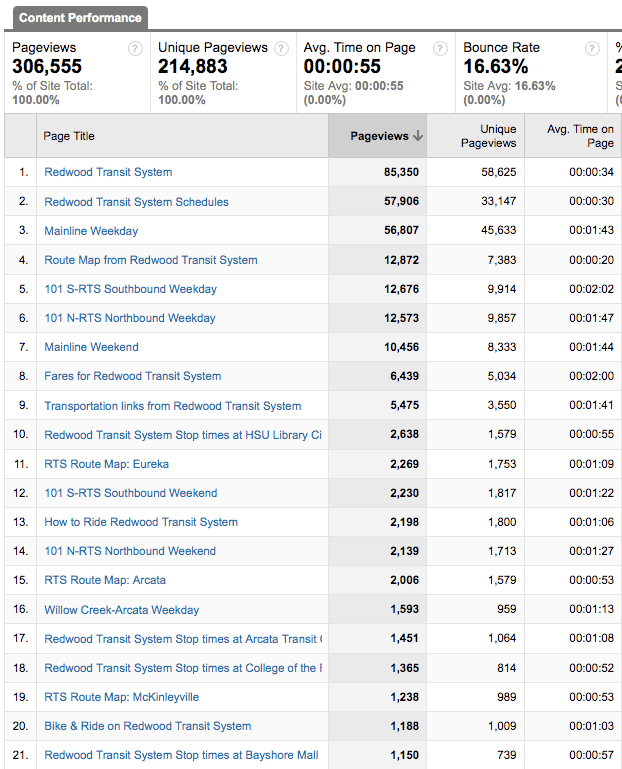
Third, here’s a breakdown of the top pages visited on the site.

Note that the Redwood Transit System website includes a feature that shows service schedules by stop. The visitor statics show the relative popularity of these stops online, and, unsurprisingly, their popularity corresponds with the relative instances of boarding/alightings documented in the most Recent Transit Development Plan for Redwood Transit System.
This points to an interesting opportunity. Transit agencies could use logs from trip planners to assess customer needs and wants. That may supplement the picture that comes from demand statistics on existing scheduled routes.
Does anyone know of agencies that do this already? Or want to implement this?